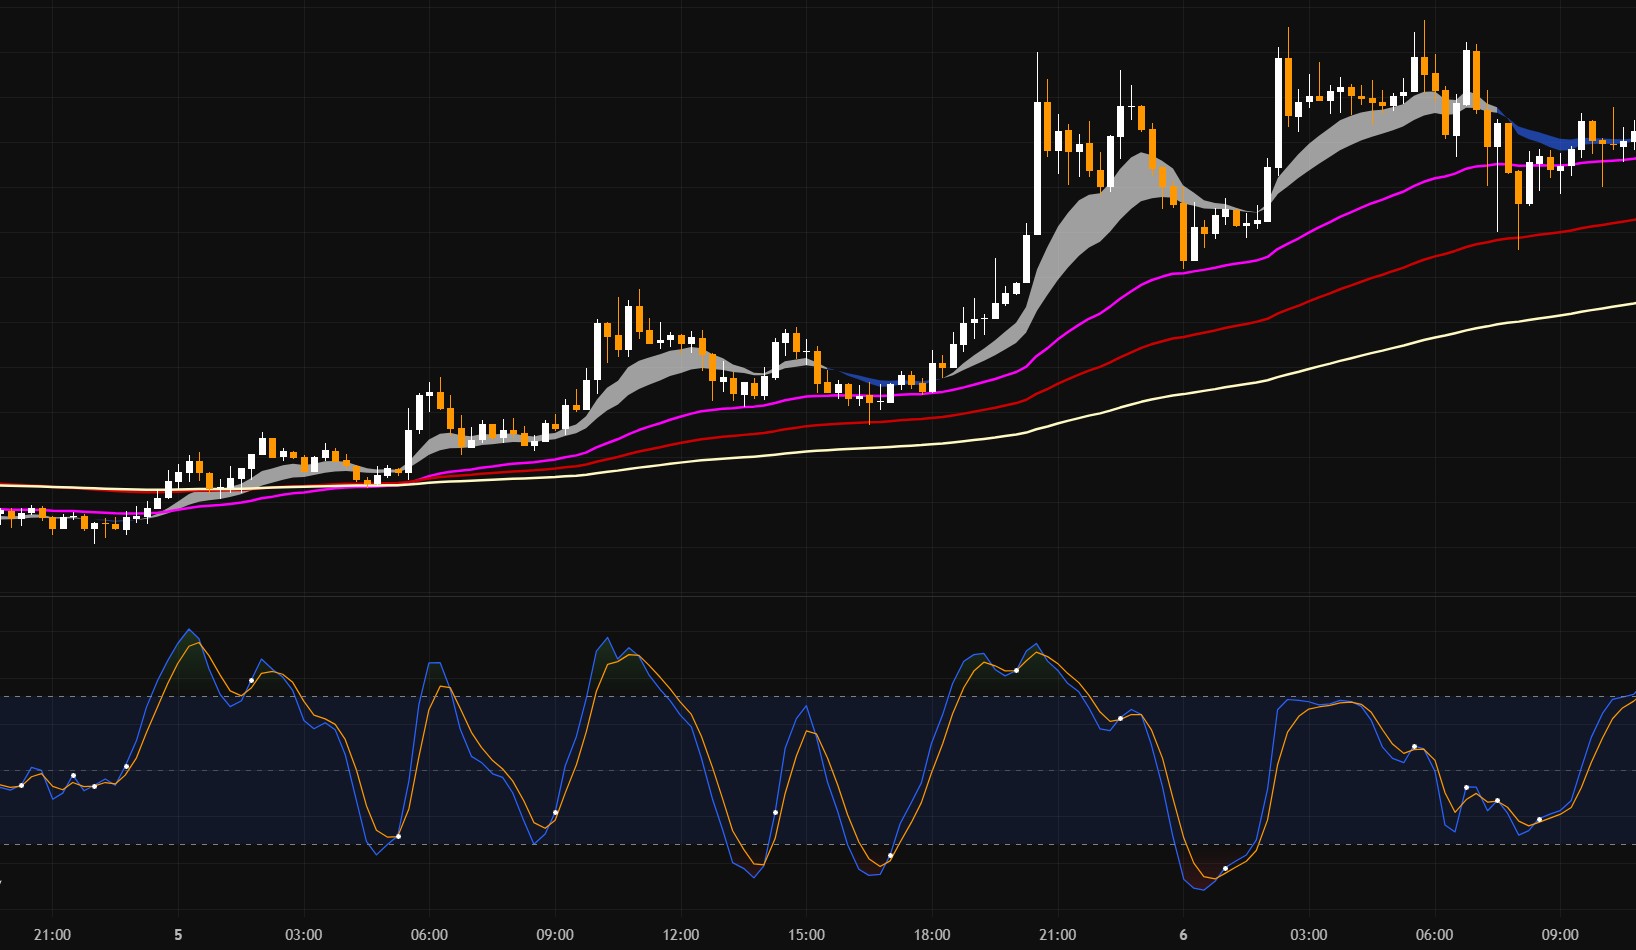
SMI 활용하기
이평선이 정배열에서 SMI 가 -40을 내려갔다 올라 올 때 SMI의 K와 D선치 교차할 때, 동그라민 신호가 나온 다음 캔들에서 진입
주의
저항선에 도달한 후 횡보할 때에는 신호가 나와도 관망
//@version=6
indicator("TJ, SMI (Stochastic Momentum Index)", timeframe = "", timeframe_gaps = true)

lengthK   = input.int(10, "%K Length",  minval = 1, maxval = 15000)
lengthD   = input.int(3,  "%D Length",  minval = 1, maxval = 4999)
lengthEMA = input.int(3,  "EMA Length", minval = 1, maxval = 4999)

emaEma(source, length) => ta.ema(ta.ema(source, length), length)

highestHigh = ta.highest(lengthK)
lowestLow =   ta.lowest(lengthK)
highestLowestRange = highestHigh - lowestLow
relativeRange = close - (highestHigh + lowestLow) / 2
smi = 200 * (emaEma(relativeRange, lengthD) / emaEma(highestLowestRange, lengthD))

smiPlot = plot(smi, "SMI", color = color.blue)
plot(ta.ema(smi, lengthEMA), "SMI-based EMA", color = color.orange)

overbought = hline(40, "Overbought Line")
oversold   = hline(-40, "Oversold Line")
fill(overbought, oversold, color = color.new(color.blue, 90))
hline(0, "Middle Line", color = color.new(color.gray, 50))


midLinePlot = plot(0, color = na, editable = false, display = display.none)
fill(smiPlot, midLinePlot, 120,  40,   top_color = color.new(#4caf4f, 50),    bottom_color = color.new(color.green, 100), title = "Overbought Gradient Fill")
fill(smiPlot, midLinePlot, -40, -120,  top_color = color.new(color.red, 100), bottom_color = color.new(color.red, 50),    title = "Oversold Gradient Fill")


// Cross
cross_k = smi
cross_d = ta.ema(smi, lengthEMA)

plot(ta.crossover(cross_k, cross_d) ? cross_k : na, title='SMI Cross Over', style=plot.style_circles, linewidth=2, color=color.new(#ffffff, 0), display=display.all)
plot(ta.crossunder(cross_k, cross_d) ? cross_k : na, title='SMI Cross Under', style=plot.style_circles, linewidth=2, color=color.new(#ff9800, 0), display=display.all)